Market Outlook
December 29, 2016
Market Cues
Domestic Indices
Chg (%)
(Pts)
(Close)
Indian markets are likely to open negative tracking SGX Nifty and global cues.
BSE Sensex
(0.0)
(3)
26,211
The US markets gave up early gains, ending broadly lower and near session lows on
Nifty
0.0
2
8,035
Wednesday with losses led by the tech sector. The The blue-chip gauge The Dow
Mid Cap
0.5
62
11,765
Jones Industrial average ended the day down 0.6%, to end at 19,834. The S&P 500
Small Cap
0.9
102
11,823
declined 0.8% to 2,250. The Nasdaq Composite lost 0.9%, to settle at 5,439 a day
Bankex
(0.0)
(4)
20,408
after closing at a record.
The FTSE 100 hit a new high for the year as shares posted solid gains in the first day
Global Indices
Chg (%)
(Pts)
(Close)
of trading since the Christmas break. The FTSE rose 0.5% to 7,102 points - above
Dow Jones
(0.6)
(111)
19,834
the close of 7,098 points on 10th October. The blue-chip index is also close to the
record close of 7,104 points reached on 27th April 2015. The rally was the result of
Nasdaq
(0.9)
(49)
5,439
optimism in the American economy, with data earlier this week showing consumer
FTSE
0.5
38
7,106
confidence in the US had hit a 15-year high.
Nikkei
(1.0)
(199)
19,203
Yesterday, Indian markets wiped off all its gains to end in the red with as cautious
Hang Seng
(0.3)
(61)
21,693
investors took profit at higher levels ahead of the monthly derivatives expiry amid a
Shanghai Com
(0.1)
(4)
3,098
mixed trend overseas. BSE Sensex closed lower by 2.76 points, or 0.01%, to 26,211,
while the Nifty 50 of the NSE rises 2 points, or 0.02%, to 8,035. Today is the expiry
Advances / Declines
BSE
NSE
of December series F&O contracts.
Advances
1,541
1,007
News Analysis
Declines
1,104
577
Hindustan Unilever launching a raft of Ayurvedic products to counter Patanjali
Unchanged
175
88
Detailed analysis on Pg2
Investor’s Ready Reckoner
Volumes (` Cr)
Key Domestic & Global Indicators
BSE
2,467
Stock Watch: Latest investment recommendations on 150+ stocks
NSE
15,704
Refer Pg5 onwards
Net Inflows (` Cr)
Net
Mtd
Ytd
Top Picks
FII
(684)
(6,628)
20,649
CMP
Target
Upside
Company
Sector
Rating
(`)
(`)
(%)
MFs
336
2,584
40,770
Amara Raja Batteries Auto & Auto Ancillary
Buy
871
1,167
34.1
Alkem Laboratories
Pharmaceuticals
Buy
1,613
1,989
23.3
Top Gainers
Price (`)
Chg (%)
HCL Tech
IT
Buy
807
1,000
23.9
Deltacorp
107
11.9
Power Grid CorporationPower
Buy
180
223
23.9
Navkar Corporation Others
Buy
157
265
68.4
Bharatfin
574
10.6
More Top Picks on Pg4
Network18
34
9.1
Mrpl
96
8.5
Key Upcoming Events
Previous
Consensus
Jubilant
612
5.2
Date
Region
Event Description
Reading
Expectations
Dec 29 US
Initial Jobless Claims
107.1
108.5
Top Losers
Price (`)
Chg (%)
Jan 01 China
Consumer Confidence
51.7
51.6
Welcorp
74
(2.6)
Jan 02 Germany
PMI Manufacturing
(5.00)
(5.00)
Apollotyre
183
(2.5)
Jan 03 Germany
Unemployment Change (000’s)
55.5
55.5
More Events on Pg4
Tatacomm
606
(2.1)
Pnb
114
(1.9)
Centurytex
784
(1.9)
As on December 28, 2016
Market Outlook
December 29, 2016
News Analysis
Hindustan Unilever launching a raft of Ayurvedic products to
counter Patanjali
Hindustan Unilever, India's largest consumer goods company, is launching a
range of Ayurvedic personal care products to compete against the product
portfolio of Baba Ramdev-led Patanjali.
Patanjali has become a `5,000cr company within a decade. Although it is still
small compared with HUL’s `30,000cr plus revenue, Patanjali has caught the
attention of all fast-moving consumer goods giants. The yoga guru-turned-FMCG
player hasn't been quiet about his ambition and in April 2016, he had said that
Patanjali can beat MNC giants such as Unilever, Colgate and Nestle.
HUL will launch around 20 products from toothpaste to skin cream and soaps to
shampoos under its existing Ayurveda brand Ayush. Ayush was launched in 2001
as a premium brand but had lost momentum by 2007. Now, the positioning will
be mass market, price points between `30 and `130.
HUL's personal care business accounts for nearly half its sales and 60% profits,
mainly due to a large portfolio of premium products. Herbal products account for
6-7% of HUL's personal products segment, but growth in this sub-segment is twice
as fast as the segment average. HUL has been reporting tepid volume growth in
India, largely due to severe slowdown in rural demand. During its September
quarter, HUL said market conditions have softened in India. HUL has a network of
roughly 8 million outlets against that of Patanjali at 10,000 Aarogya Kendras and
nearly a million kirana stores which sells the Patanjali products.
Economic and Political News
Viral Acharya appointed deputy governor of RBI
Cabinet clears Ordinance, heavy fine for holders of old notes
Direct tax collections in Mumbai, Delhi in single digit
Demonetisation: RBI eases loan repayment norms, grants additional 30 days
Narendra Modi says early budget will expedite release of funds6
Corporate News
Fresh merger structure to IRDA by Max Life-HDFC Life
Zydus Cadila acquires six brands from MSD
Reliance Jio is ready to pounce on rivals Airtel, Vodafone, Idea Cellular
Bright days ahead for commercial real estate
NSE files IPO papers with Sebi, looks to raise `10,000cr
Market Outlook
December 29, 2016
Top Picks ★★★★★
Large Cap
Market Cap
CMP
Target
Upside
Company
Rationale
(` Cr)
(`)
(`)
(%)
To outpace battery industry growth due to better technological
Amara Raja Batteries
14,869
871
1,167
34.1
products leading to market share gains in both the automotive
OEM and replacement segments.
Strong growth in domestic business due to its leadership in
Alkem Laboratories
19,282
1,613
1,989
23.3
acute therapeutic segment. Alkem expects to launch more
products in USA, which bodes for its international business.
The stock is trading at attractive valuations and is factoring all
HCL Tech
113,930
807
1,000
23.9
the bad news.
Back on the growth trend, expect a long term growth of 14% to
Infosys
229,499
999
1,249
25.0
be a US$20bn in FY2020.
Strong order backlog and improvement in execution would
Larsen & Tourbo
125,972
1,351
1,634
21.0
trigger the growth for the L&T
One of the largest pharma companies with strong international
Lupin
65,551
1,452
1,809
24.6
presence. It has a rich pipeline of ANDAs which is also one of
the largest among the generic companies.
Going forward, we expect the company to report strong top-
Power Grid Corporation
94,169
180
223
23.9
line CAGR of ~16% and bottom-line CAGR of ~19% over
FY16-18 on back of strong capitalization guidance
Source: Company, Angel Research
Mid Cap
Market Cap
CMP
Target
Upside
Company
Rationale
(` Cr)
(`)
(`)
(%)
Among the top 4 players in the consumer durables segment.
Asian Granito
638
212
351
65.6
Improved profitability backed by turn around in E&P segment.
Strong order book lends earnings visibility.
Favourable outlook for the AC industry to augur well for
Cooling products business which is out pacing the market
Bajaj Electricals
2,144
212
274
29.2
growth. EMPPAC division's profitability to improve once
operating environment turns around.
Strong loan growth backed by diversified loan portfolio and
Blue Star
4,293
449
634
41.1
adequate CAR. ROE & ROA likely to remain decent as risk of
dilution remains low. Attractive valuations considering growth.
Expectations of above average monsoon augurs well for
Dewan Housing Finance
7,554
241
350
45.1
Goodyear India as it derives ~50% of its turnover from farm
tyre segment.
Commencement of new projects, downtrend in the interest rate
Equitas Holdings
4,876
145
235
61.6
cycle, to lead to stock re-rating
Economic recovery to have favourable impact on advertising &
Jagran Prakashan
5,481
168
225
34.2
circulation revenue growth. Further, the acquisition of a radio business
(Radio City) would also boost the company`s revenue growth.
Speedier execution and speedier sales, strong revenue visibility
Mahindra Lifespace
1,433
349
522
49.5
in short-to-long run, attractive valuations
Massive capacity expansion along with rail advantage at ICD
Mirza International
996
83
107
29.2
as well CFS augurs well for the company
Earnings boost on back of stable material prices and
Navkar Corporation
2,245
157
265
68.4
favourable pricing environment. Valuation discount to peers
provides additional comfort
Strong brands and distribution network would boost growth
Siyaram Silk Mills
1,130
1,205
1,605
33.2
going ahead. Stock currently trades at an inexpensive
valuation.
Market leadership in Hindi news genre and no. 2 viewership
ranking in English news genre, exit from the radio business,
TV Today Network
1,541
258
385
49.1
and anticipated growth in ad spends by corporates to benefit
the stock.
Source: Company, Angel Research
Market Outlook
December 29, 2016
Key Upcoming Events
Global economic events release calendar
Bloomberg Data
Date
Time
Country
Event Description
Unit
Period
Last Reported
Estimated
Dec 29, 2016
7:00 PM
US
Initial Jobless claims
Thousands
Dec 24
275.00
264.00
Jan 01, 2017
6:30 AM
China PMI Manufacturing
Value
Dec
51.70
51.50
Jan 02, 2017
3:00 PM
UK PMI Manufacturing
Value
Dec
53.40
53.20
Jan 03, 2017
2:25 PM
Germany PMI Manufacturing
Value
Dec F
55.50
55.50
2:25 PM
Germany Unemployment change (000's)
Thousands
Dec
(5.00)
(5.00)
Jan 04, 2017
7:00 PM
US
Change in Nonfarm payrolls
Thousands
Dec
178.00
175.00
Jan 06, 2017
2:25 PM
Germany PMI Services
Value
Dec F
53.80
53.80
3:30 PM
Euro Zone Euro-Zone Consumer Confidence
Value
Dec F
(5.10)
(5.80)
7:00 PM
US
Unnemployment rate
%
Dec
4.60
4.70
Jan 08, 2017
China Exports YoY%
% Change
Dec
(1.60)
Jan 09, 2017
China Consumer Price Index (YoY)
% Change
Dec
2.30
Jan 10, 2017
India
Imports YoY%
% Change
Dec
10.40
India
Exports YoY%
% Change
Dec
2.30
Jan 11, 2017
3:00 PM
UK Industrial Production (YoY)
% Change
Nov
(1.10)
Jan 12, 2017
5:30 PM
India
Industrial Production YoY
% Change
Nov
(1.90)
Jan 13, 2017
US
Producer Price Index (mom)
% Change
Dec
-
Jan 16, 2017
12:00 PM
India
Monthly Wholesale Prices YoY%
% Change
Dec
3.15
Jan 17, 2017
China Industrial Production (YoY)
% Change
Dec
6.20
3:00 PM
UK CPI (YoY)
% Change
Dec
1.20
China Real GDP (YoY)
% Change
4Q
6.70
Jan 18, 2017
7:00 PM
US
Consumer price index (mom)
% Change
Dec
0.20
3:30 PM
Euro Zone Euro-Zone CPI (YoY)
%
Dec F
0.60
3:00 PM
UK Jobless claims change
% Change
Dec
2.40
7:45 PM
US
Industrial Production
%
Dec
(0.44)
Jan 19, 2017
7:00 PM
US
Housing Starts
Thousands
Dec
1,090.00
Source: Bloomberg, Angel Research
Market Outlook
December 29, 2016
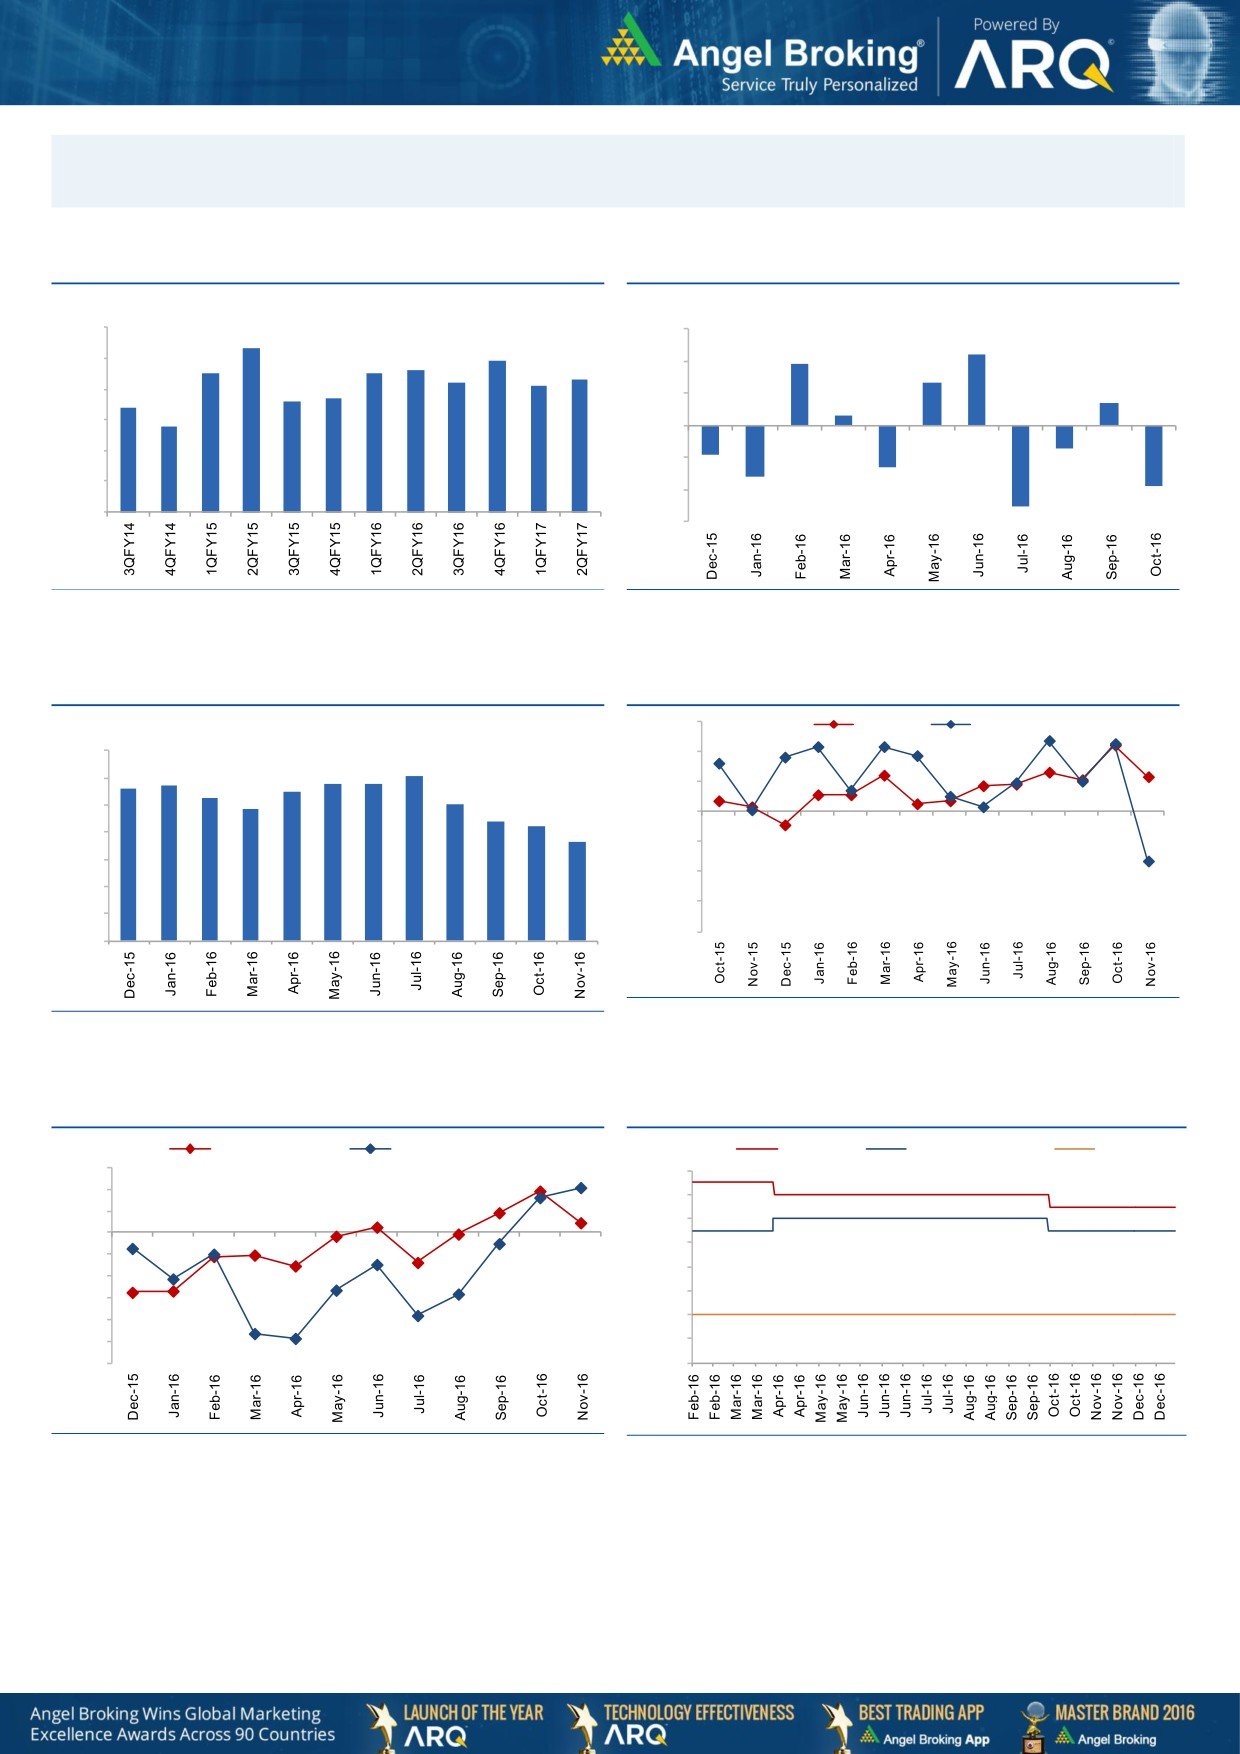
Macro watch
Exhibit 1: Quarterly GDP trends
Exhibit 2: IIP trends
(%)
(%)
9.0
8.3
3.0
2.2
7.9
1.9
7.5
7.5
7.6
8.0
7.3
2.0
7.2
7.1
1.3
6.6
6.7
0.7
7.0
6.4
1.0
0.3
5.8
6.0
-
5.0
(1.0)
(0.7)
(0.9)
4.0
(1.3)
(2.0)
(1.6)
(1.9)
3.0
(3.0)
(2.5)
Source: CSO, Angel Research
Source: MOSPI, Angel Research
Exhibit 3: Monthly CPI inflation trends
Exhibit 4: Manufacturing and services PMI
56.0
Mfg. PMI
Services PMI
(%)
7.0
54.0
6.1
5.6
5.7
5.8
5.8
6.0
5.3
5.5
52.0
5.1
4.8
5.0
4.4
4.2
50.0
3.6
4.0
48.0
3.0
46.0
2.0
44.0
1.0
42.0
-
Source: Market, Angel Research; Note: Level above 50 indicates expansion
Source: MOSPI, Angel Research
Exhibit 5: Exports and imports growth trends
Exhibit 6: Key policy rates
(%)
Exports yoy growth
Imports yoy growth
(%)
Repo rate
Reverse Repo rate
CRR
15.0
7.00
10.0
6.50
5.0
6.00
0.0
5.50
(5.0)
5.00
(10.0)
4.50
(15.0)
(20.0)
4.00
(25.0)
3.50
(30.0)
3.00
Source: Bloomberg, Angel Research
Source: RBI, Angel Research
Market Outlook
December 29, 2016
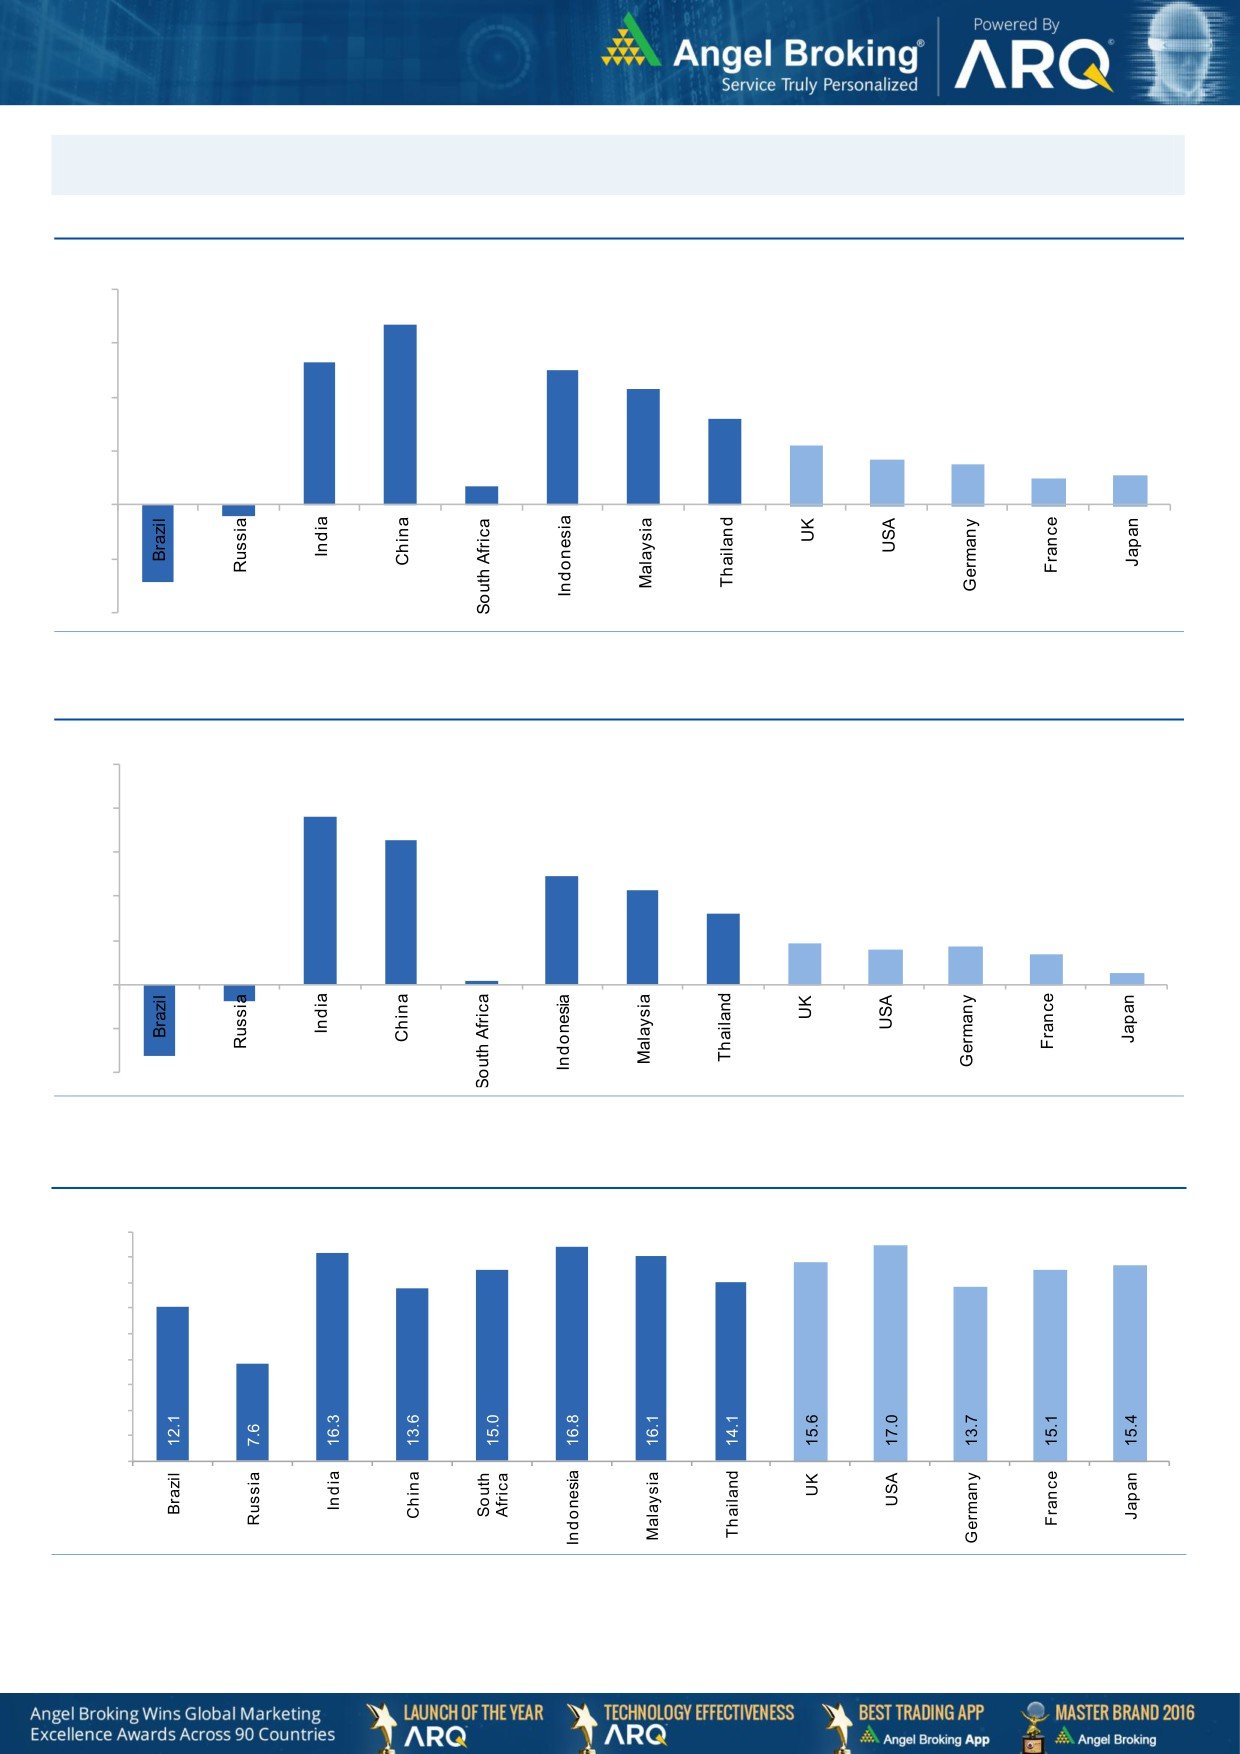
Global watch
Exhibit 1: Latest quarterly GDP Growth (%, yoy) across select developing and developed countries
(%)
8.0
6.7
5.3
6.0
5.0
0.7
4.3
4.0
3.2
2.2
1.7
2.0
1.5
1.0
1.1
-
(2.0)
(0.4)
(2.9)
(4.0)
Source: Bloomberg, Angel Research
Exhibit 2: 2016 GDP Growth projection by IMF (%, yoy) across select developing and developed countries
(%)
10.0
7.6
8.0
6.6
6.0
4.9
4.3
4.0
3.2
1.8
1.7
1.6
1.3
2.0
(0.8)
0.5
(3.3)
0.1
-
(2.0)
(4.0)
Source: IMF, Angel Research
Exhibit 3: One year forward P-E ratio across select developing and developed countries
(x)
18.0
16.0
14.0
12.0
10.0
8.0
6.0
4.0
2.0
-
Source: IMF, Angel Research
Market Outlook
December 29, 2016
Exhibit 4: Relative performance of indices across globe
Returns (%)
Country
Name of index
Closing price
1M
3M
1YR
Brazil
Bovespa
59,782
(4.5)
(0.6)
35.7
Russia
Micex
2,183
3.8
10.3
25.6
India
Nifty
8,035
(1.0)
(9.0)
2.5
China
Shanghai Composite
3,102
(4.5)
2.9
(13.0)
South Africa
Top 40
43,682
(3.8)
(5.7)
(6.6)
Mexico
Mexbol
45,563
(0.4)
(6.2)
3.7
Indonesia
LQ45
868
(3.2)
(8.6)
9.4
Malaysia
KLCI
1,630
0.4
(2.3)
(0.8)
Thailand
SET 50
951
1.4
(0.6)
13.6
USA
Dow Jones
19,834
4.8
9.2
13.7
UK
FTSE
7,106
4.1
4.4
13.8
Japan
Nikkei
19,402
5.6
15.8
0.2
Germany
DAX
11,475
7.2
10.2
11.4
France
CAC
4,848
6.5
10.0
8.0
Source: Bloomberg, Angel Research
Stock Watch
December 29, 2016
Company Name
Reco
CMP
Target
Mkt Cap
Sales ( Čcr )
OPM(%)
EPS (Č)
PER(x)
P/BV(x)
RoE(%)
EV/Sales(x)
(Č)
Price ( Č)
( Č cr )
FY17E FY18E
FY17E
FY18E
FY17E
FY18E
FY17E
FY18E
FY17E
FY18E
FY17E
FY18E
FY17E
FY18E
Agri / Agri Chemical
Rallis
Accumulate
189
209
3,683
1,937
2,164
13.3
14.3
9.0
11.0
21.0
17.2
3.7
3.2
18.4
19.8
2.0
1.7
United Phosphorus
Accumulate
631
684
31,963
15,176
17,604
18.5
18.5
37.4
44.6
16.9
14.1
3.3
2.7
21.4
21.2
2.2
1.9
Auto & Auto Ancillary
Ashok Leyland
Buy
78
111
22,255
22,407
26,022
10.6
10.6
5.2
6.4
15.0
12.2
3.4
2.9
23.6
24.7
1.1
0.9
Bajaj Auto
Neutral
2,632
-
76,150
25,093
27,891
19.5
19.2
143.9
162.5
18.3
16.2
5.1
4.4
30.3
29.4
2.8
2.4
Bharat Forge
Neutral
899
-
20,939
7,726
8,713
20.5
21.2
35.3
42.7
25.5
21.1
4.7
4.3
18.9
20.1
2.8
2.4
Eicher Motors
Neutral
20,885
-
56,814
16,583
20,447
17.5
18.0
598.0
745.2
34.9
28.0
11.9
9.1
41.2
38.3
3.2
2.6
Gabriel India
Buy
105
130
1,507
1,544
1,715
9.0
9.3
5.4
6.3
19.4
16.7
3.7
3.3
18.9
19.5
0.9
0.8
Hero Motocorp
Buy
3,005
3,541
60,003
30,958
34,139
15.7
15.7
193.6
208.3
15.5
14.4
6.1
5.0
34.2
30.5
1.8
1.6
Jamna Auto Industries Neutral
165
-
1,317
1,486
1,620
9.8
9.9
15.0
17.2
11.0
9.6
2.4
2.0
21.8
21.3
0.9
0.9
L G Balakrishnan & Bros Neutral
551
-
864
1,302
1,432
11.6
11.9
43.7
53.0
12.6
10.4
1.8
1.6
13.8
14.2
0.7
0.7
Mahindra and Mahindra Neutral
1,173
-
72,873
46,534
53,077
11.6
11.7
67.3
78.1
17.4
15.0
2.8
2.5
15.4
15.8
1.5
1.3
Maruti
Accumulate
5,231
6,006
158,014
68,057
82,958
15.8
15.5
212.1
261.2
24.7
20.0
4.9
4.1
19.8
20.3
2.0
1.6
Minda Industries
Neutral
298
-
2,363
2,728
3,042
9.0
9.1
68.2
86.2
4.4
3.5
1.0
0.8
23.8
24.3
0.9
0.8
Motherson Sumi
Neutral
315
-
44,249
45,896
53,687
7.8
8.3
13.0
16.1
24.2
19.6
7.8
6.2
34.7
35.4
1.0
0.9
Rane Brake Lining
Neutral
933
-
739
511
562
11.3
11.5
28.1
30.9
33.2
30.2
5.1
4.6
15.3
15.0
1.6
1.4
Setco Automotive
Neutral
35
-
468
741
837
13.0
13.0
15.2
17.0
2.3
2.1
0.4
0.3
15.8
16.3
1.0
0.9
Tata Motors
Neutral
463
-
133,721
300,209
338,549
8.9
8.4
42.7
54.3
10.9
8.5
1.7
1.5
15.6
17.2
0.6
0.5
TVS Motor
Neutral
353
-
16,773
13,390
15,948
6.9
7.1
12.8
16.5
27.7
21.3
6.9
5.5
26.3
27.2
1.3
1.1
Amara Raja Batteries
Buy
871
1,167
14,869
5,504
6,605
17.6
17.5
33.4
40.9
26.1
21.3
5.8
4.7
22.1
22.0
2.7
2.2
Exide Industries
Neutral
177
-
15,083
7,439
8,307
15.0
15.0
8.1
9.3
21.9
19.1
3.1
2.7
14.3
16.7
1.6
1.5
Apollo Tyres
Buy
183
235
9,325
12,877
14,504
14.3
13.9
21.4
23.0
8.6
8.0
1.3
1.2
16.4
15.2
0.9
0.8
Ceat
Buy
1,129
1,450
4,568
7,524
8,624
13.0
12.7
131.1
144.3
8.6
7.8
1.6
1.3
19.8
18.6
0.7
0.6
JK Tyres
Neutral
112
-
2,535
7,455
8,056
15.0
15.0
21.8
24.5
5.1
4.6
1.1
0.9
22.8
21.3
0.5
0.4
Swaraj Engines
Neutral
1,304
-
1,619
660
810
15.2
16.4
54.5
72.8
23.9
17.9
7.5
6.8
31.5
39.2
2.3
1.8
Subros
Neutral
155
-
932
1,488
1,681
11.7
11.9
6.4
7.2
24.3
21.7
2.6
2.3
10.8
11.4
0.8
0.7
Indag Rubber
Neutral
177
-
466
286
326
19.8
16.8
11.7
13.3
15.2
13.3
2.6
2.4
17.8
17.1
1.3
1.1
Capital Goods
ACE
Neutral
45
-
447
709
814
4.1
4.6
1.4
2.1
32.3
21.5
1.3
1.3
4.4
6.0
0.8
0.7
BEML
Neutral
974
-
4,057
3,451
4,055
6.3
9.2
31.4
57.9
31.0
16.8
1.9
1.7
6.3
10.9
1.3
1.1
Bharat Electronics
Neutral
1,359
-
30,355
8,137
9,169
16.8
17.2
58.7
62.5
23.2
21.7
3.6
3.2
44.6
46.3
2.7
2.5
Stock Watch
December 29, 2016
Company Name
Reco
CMP
Target
Mkt Cap
Sales ( Čcr )
OPM(%)
EPS (Č)
PER(x)
P/BV(x)
RoE(%)
EV/Sales(x)
(Č)
Price ( Č)
( Č cr )
FY17E
FY18E
FY17E
FY18E
FY17E
FY18E
FY17E
FY18E
FY17E
FY18E
FY17E
FY18E
FY17E
FY18E
Capital Goods
Voltas
Buy
317
407
10,477
6,511
7,514
7.9
8.7
12.9
16.3
24.6
19.4
4.4
3.9
16.7
18.5
1.4
1.2
BGR Energy
Neutral
109
-
786
16,567
33,848
6.0
5.6
7.8
5.9
14.0
18.5
0.8
0.8
4.7
4.2
0.1
0.1
BHEL
Neutral
119
-
29,200
28,797
34,742
-
2.8
2.3
6.9
51.9
17.3
0.9
0.9
1.3
4.8
0.7
0.4
Blue Star
Buy
449
634
4,293
4,283
5,077
5.9
7.3
14.9
22.1
30.2
20.3
5.9
4.9
20.4
26.4
1.0
0.9
Crompton Greaves
Neutral
59
-
3,670
5,777
6,120
5.9
7.0
3.3
4.5
17.7
13.0
0.8
0.7
4.4
5.9
0.6
0.5
Greaves Cotton
Neutral
119
-
2,905
1,755
1,881
16.8
16.9
7.8
8.5
15.3
14.0
3.1
2.8
20.6
20.9
1.3
1.2
Inox Wind
Neutral
182
-
4,038
5,605
6,267
15.7
16.4
24.8
30.0
7.3
6.1
2.0
1.5
25.9
24.4
0.8
0.6
KEC International
Neutral
136
-
3,503
9,294
10,186
7.9
8.1
9.9
11.9
13.8
11.5
2.0
1.8
15.6
16.3
0.6
0.5
Thermax
Neutral
750
-
8,940
5,421
5,940
7.3
7.3
25.7
30.2
29.2
24.8
3.5
3.2
12.2
13.1
1.5
1.4
VATech Wabag
Buy
464
681
2,533
3,136
3,845
8.9
9.1
26.0
35.9
17.9
12.9
2.2
1.9
13.4
15.9
0.7
0.6
Cement
ACC
Neutral
1,296
-
24,343
11,225
13,172
13.2
16.9
44.5
75.5
29.1
17.2
2.8
2.5
11.2
14.2
2.2
1.9
Ambuja Cements
Neutral
201
-
39,981
9,350
10,979
18.2
22.5
5.8
9.5
34.7
21.2
2.9
2.6
10.2
12.5
4.3
3.7
India Cements
Neutral
111
-
3,414
4,364
4,997
18.5
19.2
7.9
11.3
14.1
9.8
1.0
1.0
8.0
8.5
1.5
1.3
JK Cement
Neutral
674
-
4,714
4,398
5,173
15.5
17.5
31.2
55.5
21.6
12.2
2.6
2.3
12.0
15.5
1.6
1.3
J K Lakshmi Cement
Buy
350
565
4,122
2,913
3,412
14.5
19.5
7.5
22.5
46.7
15.6
2.9
2.4
12.5
18.0
2.0
1.7
Orient Cement
Buy
126
215
2,578
2,114
2,558
18.5
20.5
8.1
11.3
15.5
11.1
2.3
1.9
9.0
14.0
1.9
1.5
UltraTech Cement
Neutral
3,158
-
86,687
25,768
30,385
21.0
23.5
111.0
160.0
28.5
19.7
3.6
3.2
13.5
15.8
3.5
2.9
Construction
ITNL
Neutral
99
-
3,267
8,946
10,017
31.0
31.6
8.1
9.1
12.3
10.9
0.5
0.5
4.2
5.0
3.7
3.4
KNR Constructions
Neutral
171
-
2,409
1,385
1,673
14.7
14.0
41.2
48.5
4.2
3.5
0.8
0.7
14.9
15.2
1.6
1.4
Larsen & Toubro
Buy
1,351
1,634
125,972
111,017
124,908
11.0
11.0
61.1
66.7
22.1
20.2
2.7
2.5
13.1
12.9
2.2
2.0
Gujarat Pipavav Port
Neutral
129
-
6,251
705
788
52.2
51.7
5.0
5.6
25.9
23.1
2.6
2.3
11.2
11.2
8.6
7.2
Nagarjuna Const.
Neutral
78
-
4,350
8,842
9,775
9.1
8.8
5.3
6.4
14.8
12.2
1.2
1.1
8.2
9.1
0.6
0.6
PNC Infratech
Buy
105
143
2,681
2,350
2,904
13.1
13.2
9.0
8.8
11.6
11.9
0.4
0.4
15.9
13.9
1.2
1.0
Simplex Infra
Neutral
266
-
1,316
6,829
7,954
10.5
10.5
31.4
37.4
8.5
7.1
0.9
0.8
9.9
13.4
0.6
0.5
Power Mech Projects
Neutral
439
-
646
1,801
2,219
12.7
14.6
72.1
113.9
6.1
3.9
1.1
1.0
16.8
11.9
0.4
0.3
Sadbhav Engineering
Accumulate
273
298
4,679
3,598
4,140
10.3
10.6
9.0
11.9
30.3
22.9
3.2
2.8
9.9
11.9
1.5
1.3
NBCC
Neutral
229
-
13,749
7,428
9,549
7.9
8.6
8.2
11.0
28.0
20.8
1.4
1.1
28.2
28.7
1.5
1.1
MEP Infra
Neutral
36
-
587
1,877
1,943
30.6
29.8
3.0
4.2
12.0
8.6
5.8
3.9
0.6
0.6
1.7
1.5
SIPL
Neutral
92
-
3,240
1,036
1,252
65.5
66.2
(8.4)
(5.6)
3.5
3.9
(22.8)
(15.9)
11.3
9.4
Stock Watch
December 29, 2016
Company Name
Reco
CMP
Target
Mkt Cap
Sales ( Čcr )
OPM(%)
EPS (Č)
PER(x)
P/BV(x)
RoE(%)
EV/Sales(x)
(Č)
Price ( Č)
( Č cr )
FY17E
FY18E
FY17E
FY18E
FY17E
FY18E
FY17E
FY18E
FY17E
FY18E
FY17E
FY18E
FY17E
FY18E
Construction
Engineers India
Neutral
332
-
11,181
1,725
1,935
16.0
19.1
11.4
13.9
29.1
23.9
4.0
3.9
13.4
15.3
5.2
4.6
Financials
Axis Bank
Buy
440
630
105,097
46,932
53,575
3.5
3.4
32.4
44.6
13.6
9.9
1.8
1.5
13.6
16.5
-
-
Bank of Baroda
Neutral
150
-
34,562
19,980
23,178
1.8
1.8
11.5
17.3
13.0
8.7
1.5
1.2
8.3
10.1
-
-
Canara Bank
Neutral
264
-
14,340
15,225
16,836
1.8
1.8
14.5
28.0
18.2
9.4
1.3
1.0
5.8
8.5
-
-
Dewan Housing Finance Buy
241
350
7,554
2,225
2,688
2.9
2.9
29.7
34.6
8.1
7.0
1.3
1.1
16.1
16.8
-
-
Equitas Holdings
Buy
145
235
4,876
939
1,281
11.7
11.5
5.8
8.2
25.1
17.7
2.2
1.9
10.9
11.5
-
-
Federal Bank
Neutral
65
-
11,236
9,353
10,623
2.9
2.9
4.4
5.8
14.8
11.3
1.4
1.3
9.5
11.0
-
-
HDFC
Neutral
1,237
-
196,036
11,475
13,450
3.4
3.4
45.3
52.5
27.3
23.6
5.3
4.7
20.2
20.5
-
-
HDFC Bank
Accumulate
1,188
1,350
303,334
46,097
55,433
4.5
4.5
58.4
68.0
20.4
17.5
3.6
3.0
18.8
18.6
-
-
ICICI Bank
Buy
252
315
146,444
42,800
44,686
3.1
3.3
18.0
21.9
14.0
11.5
1.9
1.8
11.1
12.3
-
-
Lakshmi Vilas Bank
Buy
141
174
2,526
3,339
3,799
2.7
2.8
11.0
14.0
12.8
10.1
1.3
1.2
11.2
12.7
-
-
LIC Housing Finance
Buy
547
630
27,600
3,712
4,293
2.6
2.5
39.0
46.0
14.0
11.9
2.6
2.3
19.9
20.1
-
-
Punjab Natl.Bank
Neutral
114
-
24,227
23,532
23,595
2.3
2.4
6.8
12.6
16.7
9.0
2.6
1.8
3.3
6.5
-
-
RBL Bank
Neutral
328
-
12,126
1,783
2,309
2.6
2.6
12.7
16.4
25.8
20.0
2.8
2.5
12.8
13.3
-
-
South Ind.Bank
Neutral
19
-
2,575
6,435
7,578
2.5
2.5
2.7
3.1
7.1
6.2
0.9
0.8
10.1
11.2
-
-
St Bk of India
Neutral
247
-
191,935
88,650
98,335
2.6
2.6
13.5
18.8
18.3
13.2
1.7
1.5
7.0
8.5
-
-
Union Bank
Neutral
124
-
8,531
13,450
14,925
2.3
2.3
25.5
34.5
4.9
3.6
0.7
0.6
7.5
10.2
-
-
Yes Bank
Neutral
1,114
-
47,110
8,978
11,281
3.3
3.4
74.0
90.0
15.1
12.4
2.9
2.4
17.0
17.2
-
-
FMCG
Asian Paints
Neutral
877
-
84,083
17,128
18,978
16.8
16.4
19.1
20.7
45.9
42.4
16.0
15.1
34.8
35.5
4.8
4.4
Britannia
Buy
2,840
3,626
34,079
9,594
11,011
14.6
14.9
80.3
94.0
35.4
30.2
14.5
11.2
41.2
-
3.4
2.9
Colgate
Accumulate
891
995
24,226
4,605
5,149
23.4
23.4
23.8
26.9
37.4
33.1
20.7
16.2
64.8
66.8
5.2
4.6
Dabur India
Accumulate
273
304
48,151
8,315
9,405
19.8
20.7
8.1
9.2
33.8
29.7
9.4
7.8
31.6
31.0
5.4
4.7
GlaxoSmith Con*
Neutral
4,987
-
20,973
4,350
4,823
21.2
21.4
179.2
196.5
27.8
25.4
7.4
6.3
27.1
26.8
4.2
3.7
Godrej Consumer
Neutral
1,467
-
49,971
10,235
11,428
18.4
18.6
41.1
44.2
35.7
33.2
7.9
6.7
24.9
24.8
4.9
4.4
HUL
Neutral
811
-
175,447
35,252
38,495
17.8
17.8
20.7
22.4
39.3
36.2
37.5
32.2
95.6
88.9
4.8
4.4
ITC
Buy
235
284
285,276
40,059
44,439
38.3
39.2
9.0
10.1
26.2
23.2
7.3
6.4
27.8
27.5
6.6
5.9
Marico
Buy
251
300
32,321
6,430
7,349
18.8
19.5
6.4
7.7
39.1
32.5
11.8
9.9
33.2
32.5
4.8
4.1
Nestle*
Neutral
5,885
-
56,739
10,073
11,807
20.7
21.5
124.8
154.2
47.2
38.2
19.4
17.4
34.8
36.7
5.4
4.6
Tata Global
Neutral
120
-
7,548
8,675
9,088
9.8
9.8
7.4
8.2
16.2
14.6
1.8
1.8
7.9
8.1
0.8
0.7
Stock Watch
December 29, 2016
Company Name
Reco
CMP
Target
Mkt Cap
Sales ( Čcr )
OPM(%)
EPS (Č)
PER(x)
P/BV(x)
RoE(%)
EV/Sales(x)
(Č)
Price ( Č)
( Č cr )
FY17E FY18E
FY17E
FY18E
FY17E
FY18E
FY17E
FY18E
FY17E
FY18E
FY17E
FY18E
FY17E
FY18E
FMCG
Procter & Gamble
Neutral
6,938
-
22,523
2,939
3,342
23.2
23.0
146.2
163.7
47.5
42.4
106.3
101.9
25.3
23.5
7.3
6.3
Hygiene
IT
HCL Tech^
Buy
807
1,000
113,930
49,242
57,168
20.5
20.5
55.7
64.1
14.5
12.6
3.0
2.3
20.3
17.9
2.2
1.8
Infosys
Buy
999
1,249
229,499
68,350
77,326
27.0
27.0
62.5
69.4
16.0
14.4
3.4
3.1
21.3
21.6
2.8
2.4
TCS
Accumulate
2,316
2,620
456,312
119,025
133,308
27.6
27.6
131.2
145.5
17.7
15.9
5.7
5.3
32.4
33.1
3.6
3.2
Tech Mahindra
Buy
474
600
46,111
29,673
32,937
15.5
17.0
32.8
39.9
14.5
11.9
2.8
2.5
19.6
20.7
1.3
1.1
Wipro
Buy
469
590
114,093
55,440
60,430
18.1
18.1
35.9
39.9
13.1
11.8
2.3
2.2
19.0
19.3
1.7
1.6
Media
D B Corp
Neutral
358
-
6,580
2,297
2,590
27.4
28.2
21.0
23.4
17.0
15.3
4.0
3.4
23.7
23.1
2.7
2.3
HT Media
Neutral
72
-
1,676
2,693
2,991
12.6
12.9
7.9
9.0
9.1
8.0
0.8
0.7
7.8
8.3
0.2
0.1
Jagran Prakashan
Buy
168
225
5,481
2,355
2,635
28.0
28.0
10.8
12.5
15.5
13.4
3.4
2.9
21.7
21.7
2.3
2.0
Sun TV Network
Neutral
479
-
18,877
2,850
3,265
70.1
71.0
26.2
30.4
18.3
15.8
4.7
4.1
24.3
25.6
6.3
5.3
Hindustan Media
Neutral
261
-
1,918
1,016
1,138
24.3
25.2
27.3
30.1
9.6
8.7
1.8
1.6
16.2
15.8
1.2
1.1
Ventures
TV Today Network
Buy
258
385
1,541
637
743
27.5
27.5
18.4
21.4
14.1
12.1
2.5
2.1
17.4
17.2
2.0
1.6
Metals & Mining
Coal India
Neutral
295
-
183,305
84,638
94,297
21.4
22.3
24.5
27.1
12.1
10.9
5.0
4.8
42.6
46.0
1.6
1.5
Hind. Zinc
Neutral
250
-
105,570
14,252
18,465
55.9
48.3
15.8
21.5
15.8
11.6
2.6
2.3
17.0
20.7
7.5
5.8
Hindalco
Neutral
154
-
31,736
107,899
112,095
7.4
8.2
9.2
13.0
16.7
11.8
0.8
0.8
4.8
6.6
0.8
0.8
JSW Steel
Neutral
1,584
-
38,298
53,201
58,779
16.1
16.2
130.6
153.7
12.1
10.3
1.6
1.4
14.0
14.4
1.5
1.3
NMDC
Neutral
121
-
38,315
6,643
7,284
44.4
47.7
7.1
7.7
17.1
15.7
1.5
1.4
8.8
9.2
3.6
3.2
SAIL
Neutral
48
-
19,928
47,528
53,738
(0.7)
2.1
(1.9)
2.6
18.6
0.5
0.5
(1.6)
3.9
1.3
1.2
Vedanta
Neutral
212
-
62,822
71,744
81,944
19.2
21.7
13.4
20.1
15.8
10.5
1.4
1.2
8.4
11.3
1.3
1.0
Tata Steel
Neutral
388
-
37,712
121,374
121,856
7.2
8.4
18.6
34.3
20.9
11.3
1.3
1.2
6.1
10.1
1.0
0.9
Oil & Gas
Cairn India
Neutral
239
-
44,833
9,127
10,632
4.3
20.6
8.8
11.7
27.2
20.4
0.9
0.9
3.3
4.2
6.4
5.4
GAIL
Neutral
424
-
53,790
56,220
65,198
9.3
10.1
27.1
33.3
15.7
12.7
1.4
1.3
9.3
10.7
1.1
1.0
ONGC
Neutral
190
-
243,447
137,222
152,563
15.0
21.8
19.5
24.1
9.7
7.9
0.8
0.8
8.5
10.1
2.1
1.8
Indian Oil Corp
Neutral
316
-
153,544
373,359
428,656
5.9
5.5
54.0
59.3
5.9
5.3
0.9
0.8
16.0
15.6
0.6
0.5
Reliance Industries
Neutral
1,052
-
341,291
301,963
358,039
12.1
12.6
87.7
101.7
12.0
10.4
1.2
1.1
10.7
11.3
1.6
1.3
Pharmaceuticals
Alembic Pharma
Neutral
609
-
11,480
3,483
4,083
20.2
21.4
24.3
30.4
25.1
20.0
5.7
4.6
25.5
25.3
3.2
2.7
Alkem Laboratories Ltd
Buy
1,613
1,989
19,282
6,043
6,893
18.7
19.3
80.5
88.8
20.0
18.2
4.5
3.7
22.3
20.3
3.1
2.7
Aurobindo Pharma
Buy
652
877
38,141
15,720
18,078
23.7
23.7
41.4
47.3
15.7
13.8
4.1
3.2
29.6
26.1
2.6
2.3
Sanofi India*
Neutral
4,236
-
9,756
2,277
2,597
17.3
18.3
149.4
172.0
28.4
24.6
4.7
3.8
25.1
28.8
3.9
3.2
Stock Watch
December 29, 2016
Company Name
Reco
CMP
Target
Mkt Cap
Sales ( Čcr )
OPM(%)
EPS (Č)
PER(x)
P/BV(x)
RoE(%)
EV/Sales(x)
(Č)
Price ( Č)
( Č cr )
FY17E FY18E
FY17E
FY18E
FY17E
FY18E
FY17E
FY18E
FY17E
FY18E
FY17E
FY18E
FY17E
FY18E
Pharmaceuticals
Cadila Healthcare
Accumulate
350
400
35,877
10,429
12,318
22.6
22.0
16.9
19.2
20.7
18.3
5.3
4.2
28.5
25.7
3.4
2.8
Cipla
Reduce
563
490
45,259
15,378
18,089
17.4
18.4
21.6
27.2
26.1
20.7
3.4
2.9
13.7
15.2
3.1
2.6
Dr Reddy's
Neutral
3,071
-
50,866
16,043
18,119
20.8
22.4
112.4
142.9
27.3
21.5
3.7
3.2
14.1
15.9
3.1
2.7
Dishman Pharma
Neutral
210
-
3,384
1,718
1,890
22.7
22.8
9.5
11.3
22.1
18.6
2.1
1.9
10.1
10.9
2.4
2.1
GSK Pharma*
Neutral
2,694
-
22,821
3,000
3,312
15.4
20.6
46.5
60.8
57.9
44.3
13.9
13.9
26.3
30.6
7.4
6.7
Indoco Remedies
Neutral
264
-
2,430
1,112
1,289
16.2
18.2
11.6
16.0
22.7
16.5
3.6
3.1
17.0
20.1
2.2
1.9
Ipca labs
Buy
522
613
6,589
3,303
3,799
15.3
15.3
17.3
19.7
30.2
26.5
2.6
2.4
9.1
9.4
2.1
1.8
Lupin
Buy
1,452
1,809
65,551
15,912
18,644
26.4
26.7
58.1
69.3
25.0
21.0
4.9
4.0
21.4
20.9
4.2
3.4
Sun Pharma
Buy
622
847
149,135
31,129
35,258
32.0
32.9
30.2
35.3
20.6
17.6
3.4
2.8
20.0
20.1
4.4
3.7
Power
Tata Power
Neutral
74
-
19,987
36,916
39,557
17.4
27.1
5.1
6.3
14.5
11.7
1.3
1.2
9.0
10.3
1.6
1.4
NTPC
Neutral
161
-
132,587
86,605
95,545
17.5
20.8
11.8
13.4
13.6
12.0
1.4
1.3
10.5
11.1
2.9
2.9
Power Grid
Buy
180
223
94,169
25,315
29,193
88.2
88.7
14.2
17.2
12.7
10.5
1.9
1.7
15.2
16.1
8.4
7.6
Real Estate
MLIFE
Buy
349
522
1,433
1,152
1,300
22.7
24.6
29.9
35.8
11.7
9.8
0.9
0.8
7.6
8.6
2.0
1.6
Telecom
Bharti Airtel
Neutral
300
-
120,002
105,086
114,808
34.5
34.7
12.2
16.4
24.6
18.3
1.7
1.6
6.8
8.4
2.0
1.8
Idea Cellular
Neutral
71
-
25,695
40,133
43,731
37.2
37.1
6.4
6.5
11.2
11.0
0.9
0.9
8.2
7.6
1.6
1.4
zOthers
Abbott India
Neutral
4,623
-
9,824
3,153
3,583
14.1
14.4
152.2
182.7
30.4
25.3
149.1
127.4
25.6
26.1
2.8
2.4
Bajaj Electricals
Buy
212
274
2,144
4,801
5,351
5.7
6.2
10.4
13.7
20.3
15.5
2.5
2.2
12.4
14.5
0.4
0.4
Finolex Cables
Neutral
417
-
6,374
2,883
3,115
12.0
12.1
14.2
18.6
29.4
22.4
15.6
13.6
15.8
14.6
1.9
1.7
Goodyear India*
Neutral
649
-
1,497
1,598
1,704
10.4
10.2
49.4
52.6
13.1
12.3
60.6
53.2
18.2
17.0
0.6
85.6
Hitachi
Neutral
1,387
-
3,771
2,081
2,433
8.8
8.9
33.4
39.9
41.5
34.8
33.5
27.9
22.1
21.4
1.8
1.5
Jyothy Laboratories
Neutral
341
-
6,193
1,440
2,052
11.5
13.0
8.5
10.0
40.1
34.1
9.7
9.0
18.6
19.3
4.5
3.1
Page Industries
Neutral
12,947
-
14,441
2,450
3,124
20.1
17.6
299.0
310.0
43.3
41.8
288.4
220.1
47.1
87.5
5.9
4.7
Relaxo Footwears
Neutral
401
-
4,812
2,085
2,469
9.2
8.2
7.6
8.0
53.0
50.4
20.5
17.5
17.9
18.8
2.4
2.1
Siyaram Silk Mills
Accumulate
1,205
1,605
1,130
1,733
1,948
11.6
11.7
96.6
114.7
12.5
10.5
1.9
1.7
15.3
15.7
0.9
0.8
Styrolution ABS India*
Neutral
581
-
1,022
1,440
1,537
9.2
9.0
40.6
42.6
14.3
13.6
36.5
33.2
12.3
11.6
0.7
0.6
TVS Srichakra
Neutral
3,178
-
2,433
2,304
2,614
13.7
13.8
231.1
266.6
13.8
11.9
357.0
281.1
33.9
29.3
1.1
0.9
HSIL
Neutral
277
-
2,006
2,384
2,515
15.8
16.3
15.3
19.4
18.1
14.3
18.0
15.5
7.8
9.3
1.0
0.9
Kirloskar Engines India
Neutral
324
-
4,684
2,554
2,800
9.9
10.0
10.5
12.1
30.9
26.8
12.9
12.2
10.7
11.7
1.5
1.3
Ltd
M M Forgings
Neutral
436
-
527
546
608
20.4
20.7
41.3
48.7
10.6
9.0
59.8
52.9
16.6
17.0
0.8
0.7
Stock Watch
December 29, 2016
Company Name
Reco
CMP
Target
Mkt Cap
Sales ( Čcr )
OPM(%)
EPS (Č)
PER(x)
P/BV(x)
RoE(%)
EV/Sales(x)
(Č)
Price ( Č)
( Č cr )
FY17E
FY18E
FY17E
FY18E
FY17E
FY18E
FY17E
FY18E
FY17E
FY18E
FY17E
FY18E
FY17E
FY18E
zOthers
Banco Products (India) Neutral
175
-
1,251
1,353
1,471
12.3
12.4
14.5
16.3
12.1
10.7
16.7
15.0
14.5
14.6
0.9
90.8
Competent Automobiles Neutral
153
-
94
1,137
1,256
3.1
2.7
28.0
23.6
5.5
6.5
29.4
26.6
14.3
11.5
0.1
0.1
Nilkamal
Neutral
1,247
-
1,860
1,995
2,165
10.7
10.4
69.8
80.6
17.9
15.5
71.2
61.9
16.6
16.5
0.9
0.8
Visaka Industries
Neutral
179
-
284
1,051
1,138
10.3
10.4
21.0
23.1
8.5
7.7
22.9
21.5
9.0
9.2
0.5
0.5
Transport Corporation of
Neutral
145
-
1,112
2,671
2,911
8.5
8.8
13.9
15.7
10.5
9.3
1.4
1.3
13.7
13.8
0.5
0.5
India
Elecon Engineering
Neutral
57
-
635
1,482
1,660
13.7
14.5
3.9
5.8
14.5
9.8
3.4
3.1
7.8
10.9
0.7
0.7
Surya Roshni
Neutral
175
-
768
3,342
3,625
7.8
7.5
17.3
19.8
10.1
8.9
19.3
15.5
10.5
10.8
0.5
0.4
MT Educare
Neutral
118
-
469
366
417
17.7
18.2
9.4
10.8
12.6
10.9
2.8
2.4
22.2
22.3
1.1
1.0
Radico Khaitan
Buy
111
147
1,476
1,667
1,824
13.0
13.2
6.7
8.2
16.7
13.6
1.5
1.4
9.0
10.2
1.3
1.1
Garware Wall Ropes
Neutral
605
-
1,325
873
938
14.3
14.3
35.2
37.5
17.2
16.2
3.0
2.6
17.5
15.9
1.4
1.3
Wonderla Holidays
Neutral
344
-
1,944
287
355
38.0
40.0
11.3
14.2
30.5
24.2
4.4
3.8
21.4
23.9
6.4
5.2
Linc Pen & Plastics
Neutral
237
-
351
382
420
9.3
9.5
13.5
15.7
17.6
15.1
3.0
2.6
17.1
17.3
1.0
0.9
The Byke Hospitality
Neutral
165
-
661
287
384
20.5
20.5
7.6
10.7
21.7
15.4
4.5
3.7
20.7
23.5
2.3
1.7
Interglobe Aviation
Neutral
830
-
29,995
21,122
26,005
14.5
27.6
110.7
132.1
7.5
6.3
44.9
32.0
168.5
201.1
1.4
1.1
Coffee Day Enterprises
Neutral
196
-
4,029
2,964
3,260
20.5
21.2
4.7
8.0
-
24.4
2.3
2.1
5.5
8.5
1.7
1.5
Ltd
Navneet Education
Neutral
110
-
2,619
1,062
1,147
24.0
24.0
6.1
6.6
18.1
16.6
3.7
3.3
20.6
19.8
2.5
2.3
Navkar Corporation
Buy
157
265
2,245
369
561
42.9
42.3
7.2
11.5
21.8
13.7
1.6
1.4
7.4
10.5
7.2
4.7
UFO Moviez
Neutral
403
-
1,113
619
685
33.2
33.4
30.0
34.9
13.5
11.6
1.9
1.6
13.8
13.9
1.5
1.2
VRL Logistics
Neutral
260
-
2,368
1,902
2,119
16.7
16.6
14.6
16.8
17.8
15.4
3.9
3.4
21.9
22.2
1.4
1.2
Team Lease Serv.
Neutral
875
-
1,496
3,229
4,001
1.5
1.8
22.8
32.8
38.4
26.6
4.1
3.6
10.7
13.4
0.4
0.3
S H Kelkar & Co.
Neutral
303
-
4,379
1,036
1,160
15.1
15.0
6.1
7.2
49.6
42.2
5.3
4.9
10.7
11.5
4.0
3.5
Quick Heal
Neutral
251
-
1,759
408
495
27.3
27.0
7.7
8.8
32.4
28.6
3.0
3.0
9.3
10.6
3.4
2.8
Narayana Hrudaya
Neutral
334
-
6,822
1,873
2,166
11.5
11.7
2.6
4.0
126.2
84.2
7.7
7.0
6.1
8.3
3.8
3.3
Manpasand Bever.
Neutral
520
-
2,974
836
1,087
19.6
19.4
16.9
23.8
30.8
21.8
3.7
3.2
12.0
14.8
3.3
2.4
Parag Milk Foods
Neutral
263
-
2,210
1,919
2,231
9.3
9.6
9.5
12.9
27.8
20.3
4.3
3.6
15.5
17.5
1.3
1.1
Mirza International
Buy
83
107
996
987
1,106
18.0
18.0
6.5
7.6
12.7
10.9
2.0
1.7
15.9
15.7
1.2
1.1
Asian Granito
Buy
212
351
638
1,071
1,182
12.1
12.4
12.7
16.0
16.7
13.3
1.6
1.4
9.5
10.7
0.9
0.8
Source: Company, Angel Research; Note: *December year end; #September year end; &October year end; Price as on December 28, 2016
Market Outlook
December 29, 2016
Research Team Tel: 022 - 39357800
DISCLAIMER
Angel Broking Private Limited (hereinafter referred to as “Angel”) is a registered Member of National Stock Exchange of India Limited,
Bombay Stock Exchange Limited and Metropolitan Stock Exchange Limited. It is also registered as a Depository Participant with CDSL
and Portfolio Manager with SEBI. It also has registration with AMFI as a Mutual Fund Distributor. Angel Broking Private Limited is a
registered entity with SEBI for Research Analyst in terms of SEBI (Research Analyst) Regulations, 2014 vide registration number
INH000000164. Angel or its associates has not been debarred/ suspended by SEBI or any other regulatory authority for accessing
/dealing in securities Market. Angel or its associates/analyst has not received any compensation / managed or co-managed public
offering of securities of the company covered by Analyst during the past twelve months.
This document is solely for the personal information of the recipient, and must not be singularly used as the basis of any investment
decision. Nothing in this document should be construed as investment or financial advice. Each recipient of this document should make
such investigations as they deem necessary to arrive at an independent evaluation of an investment in the securities of the companies
referred to in this document (including the merits and risks involved), and should consult their own advisors to determine the merits and
risks of such an investment.
Reports based on technical and derivative analysis center on studying charts of a stock's price movement, outstanding positions and
trading volume, as opposed to focusing on a company's fundamentals and, as such, may not match with a report on a company's
fundamentals. Investors are advised to refer the Fundamental and Technical Research Reports available on our website to evaluate the
contrary view, if any.
The information in this document has been printed on the basis of publicly available information, internal data and other reliable
sources believed to be true, but we do not represent that it is accurate or complete and it should not be relied on as such, as this
document is for general guidance only. Angel Broking Pvt. Limited or any of its affiliates/ group companies shall not be in any way
responsible for any loss or damage that may arise to any person from any inadvertent error in the information contained in this report.
Angel Broking Pvt. Limited has not independently verified all the information contained within this document. Accordingly, we cannot
testify, nor make any representation or warranty, express or implied, to the accuracy, contents or data contained within this document.
While Angel Broking Pvt. Limited endeavors to update on a reasonable basis the information discussed in this material, there may be
regulatory, compliance, or other reasons that prevent us from doing so.
This document is being supplied to you solely for your information, and its contents, information or data may not be reproduced,
redistributed or passed on, directly or indirectly.
Neither Angel Broking Pvt. Limited, nor its directors, employees or affiliates shall be liable for any loss or damage that may arise from
or in connection with the use of this information.